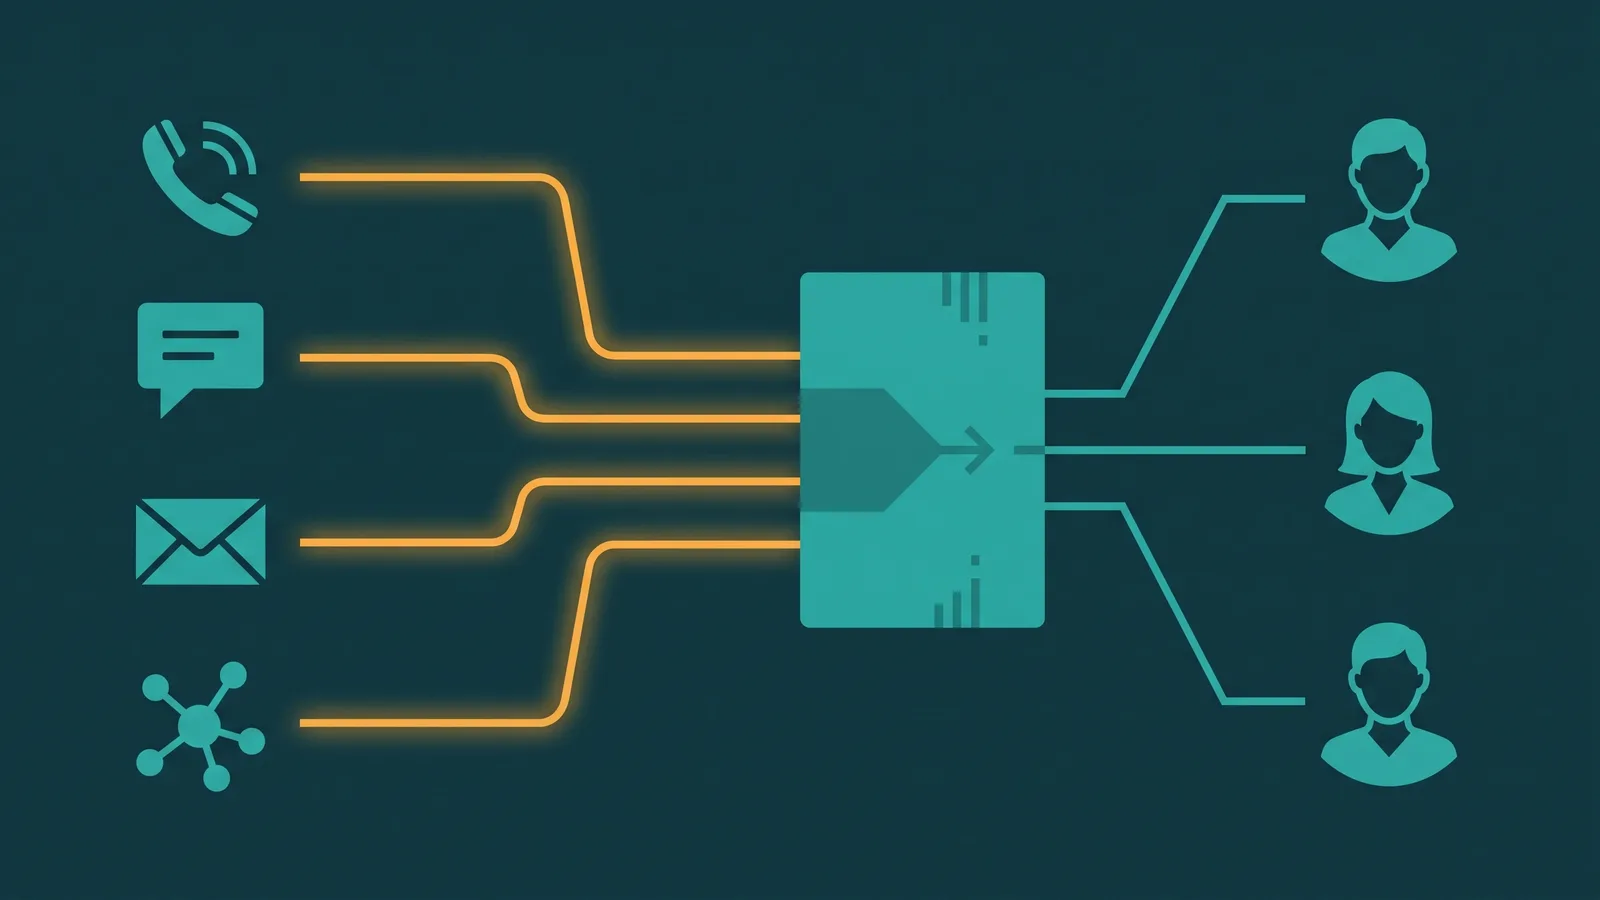
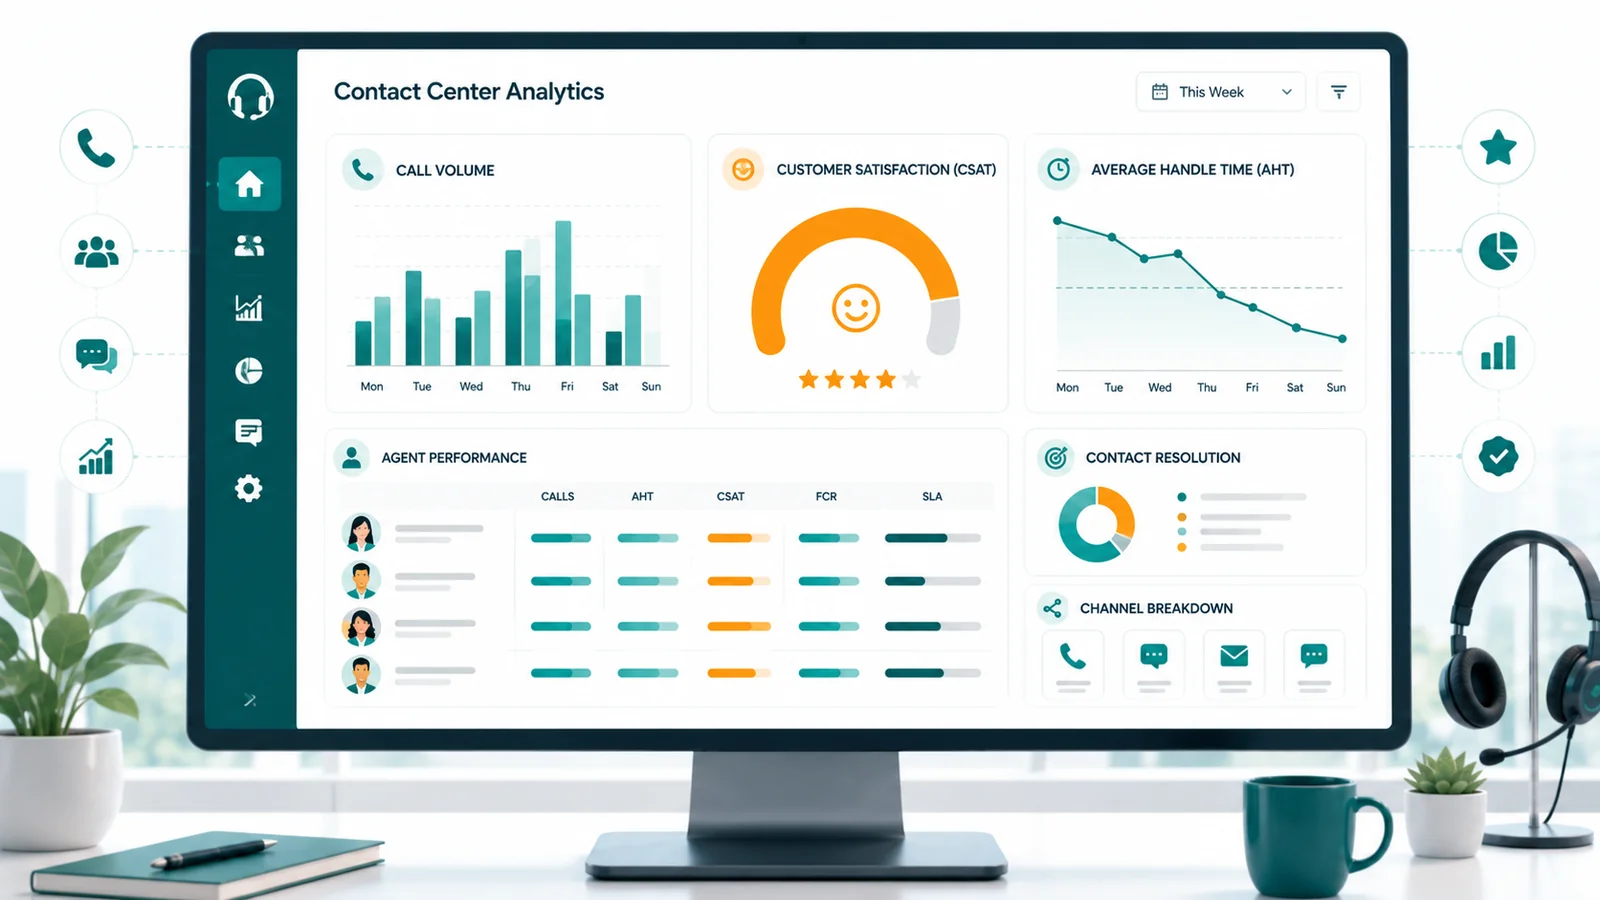
Contact center analytics is the measurement and analysis of data generated by customer interactions — phone calls, chats, emails, and callbacks — to improve operational efficiency, service quality, and customer outcomes. It spans real-time dashboards for supervisors managing a shift and historical reports for staffing, coaching, and routing decisions over time.
What contact center analytics actually does
Most contact center software generates more data than teams know what to do with. The challenge is not getting data — it's knowing which metrics actually reflect performance, how to read them without being misled, and how to connect what you're measuring to decisions that change outcomes. Collecting data is not analytics. The value comes from using that data to answer specific operational questions.
Start with the operational question
Analytics is most useful when it starts with a specific question rather than a dashboard. Common operational questions analytics should be able to answer:
- Why are callers abandoning?
- Why is service level falling?
- Why is AHT rising?
- Why are repeat contacts increasing?
- Why are some agents overloaded?
Metric groups
Demand and access
Service Level is the percentage of calls answered within a target threshold — commonly expressed as 80% answered in 20 seconds (80/20). It is a staffing metric as much as a performance metric. Consistently missing your service level target usually indicates understaffing, poor schedule adherence, or demand exceeding forecast — not individual agent performance.
Abandonment Rate is the percentage of callers who hang up before reaching an agent. High abandonment correlates with long wait times and is a leading indicator of degrading service level. Strip out calls abandoned in the first 5–10 seconds (misdials and instant hang-ups) to get a more accurate picture of frustration-driven abandonment.
Average Speed of Answer (ASA) is an average, which means it's dragged up by outliers. A small number of very long waits produces a poor ASA even if most callers are answered quickly. Service level (% answered within threshold) is a more useful measure of the typical caller experience.
Efficiency
Average Handle Time (AHT) = Average Talk Time + Average Hold Time + Average After-Call Work Time. A low AHT is not automatically good — it may mean agents are cutting calls short or transferring rather than resolving. A high AHT is not automatically bad if FCR is also high. The useful analysis is AHT by call type. Overall AHT is a blended number that hides important variation.
Agent Utilization and Occupancy measures what percentage of an agent's logged-in time is spent handling contacts. High occupancy (above 85–90%) is a warning sign: at very high occupancy, error rates increase and burnout accelerates. The optimal range for sustained performance is typically 80–85%.
Transfer Rate is the percentage of calls transferred to another agent or queue after initial answer. A high transfer rate indicates routing inefficiency or knowledge gaps. Both are fixable through routing redesign and training. See the call routing guide for routing improvement strategies.
Calls per hour looks like a productivity metric but is easily gamed — agents who rush calls or transfer unnecessarily inflate it. Only meaningful when paired with FCR and CSAT for the same agent. High calls-per-hour with low FCR means the agent is creating more work than they're handling.
Resolution quality
First Contact Resolution (FCR) measures the percentage of contacts resolved in a single interaction without the customer calling back about the same issue. It correlates with both customer satisfaction and operating cost — a resolved call doesn't generate a repeat call. FCR is hard to measure accurately. The most reliable approach is repeat contact tracking (flag any callback within 7–30 days about the same issue) combined with periodic calibration against post-call survey data.
Customer outcome
Customer Satisfaction (CSAT) measures satisfaction with a specific interaction, typically via a post-call survey. It directly reflects caller experience quality and is most sensitive to agent behavior, resolution quality, and wait time. The limitation: very satisfied and very dissatisfied customers respond at higher rates than moderately satisfied ones. Use CSAT as a directional signal and basis for qualitative research rather than a precise measurement.
Diagnostic relationships
Metrics become more useful when read together. Some patterns worth investigating:
- Abandonment rising + service level falling may indicate a capacity or wait-time problem rather than an agent performance issue.
- AHT rising + FCR rising often suggests longer calls are solving more — not less. Reducing AHT in this scenario may hurt resolution quality.
- Low AHT + low FCR worth investigating: agents may be ending calls quickly without resolving the issue, generating repeat contacts.
- Occupancy above 85% + service level falling often suggests staffing or capacity pressure — not a scheduling adherence issue.
- High transfer rate may indicate routing inefficiency, knowledge gaps, or both. Either is fixable through routing redesign or targeted training.
Real-time vs. historical analytics
| Real-time analytics | Historical reporting | |
|---|---|---|
| Purpose | Intraday decision making — queue management, staffing adjustments | Trend analysis, performance review, staffing planning, coaching |
| Time horizon | Current moment, last 15–30 minutes | Day, week, month, quarter |
| Primary users | Supervisors, team leads | Managers, analysts, workforce planning |
| Key metrics | Agents available, calls in queue, current AHT, in-interval service level | FCR, AHT by call type, CSAT trends, abandonment, agent scorecards |
| Actions taken | Bring agents off break early, activate backup queue, redirect overflow | Adjust schedules, update training, redesign routing rules |
The most common analytics mistake is building a historical reporting view and calling it a "real-time dashboard." Supervisors need to see what is happening right now at the agent and queue level. A report refreshing every 30 minutes doesn't tell a supervisor which agent is currently on hold with an angry customer who needs to be rescued.
EaseDial Analytics
Real-time supervisor view and historical agent scorecards — built into the same platform as your queues and routing.
Dashboard design
- Operational metrics (real-time): Queue depth, agents available, calls in progress. Visible to supervisors. Updated continuously. Drives intraday staffing decisions.
- Performance metrics (daily/weekly): Service level, AHT, abandonment, FCR, CSAT. Reviewed in team meetings. Drives coaching conversations.
- Agent scorecards (weekly/monthly): Per-agent breakdown with trend lines. Used for performance reviews and identifying coaching needs. Include qualitative QA scores alongside quantitative metrics.
- Strategic metrics (monthly/quarterly): NPS trend, contact volume by category, cost per contact, capacity vs. demand. Drives resourcing and routing design decisions.
Each layer has different audiences and drives different decisions. Combining them into a single dashboard usually means none of them work well.
Measurement traps
Schedule adherence measures whether agents are available at scheduled times. But adherence doesn't measure whether the schedule itself is correct. Perfect adherence to a badly designed schedule is not the same as good staffing. Review workforce management practices alongside adherence metrics.
Interaction analytics
- Topic categorization: Automatically classify calls by subject — replaces or supplements agent-entered call dispositions with more consistent tagging.
- Phrase detection: Flag calls where specific phrases appear — competitor mentions, escalation language, compliance keywords. Useful for QA and compliance monitoring.
- Silence detection: Identify extended silence — often a signal that the agent is searching for information, the caller is frustrated, or a technical problem is occurring.
- Sentiment scoring: Classify emotional tone at the call level and at specific moments. See the caveats in AI in contact centers on current limitations of emotion detection.
Frequently asked questions
Contact center analytics creates value when it drives decisions — a supervisor sees queue depth rising and moves an agent, a coaching conversation surfaces a pattern in an agent's transfer rate, monthly reporting identifies a call type accounting for 30% of volume that isn't represented in any routing optimization.
The test for any metric: "If this number changed, what would we do differently?" If the answer is nothing, it probably doesn't belong in your core reporting.
For a broader look at contact center technology, see the CCaaS guide and the cloud contact center overview. For AI-powered analytics applications, see AI in contact centers. For a focused reference on individual metric definitions and formulas, see call center metrics and KPIs. For CSAT measurement detail, see what is CSAT.
See EaseDial analytics: Real-time agent dashboards, queue stats, campaign analytics, and AI sentiment scoring — all in one reporting view. Analytics feature details →